
Photo by Courtney Celley, USFWS.

Photo by Courtney Celley, USFWS.
Every year hunters in Illinois head into the woods to continue a tradition of hunting deer passed down through generations. They prepare through education, obtain permits, and follow mandatory tagging and processing rules (Hunt Illinois). And every year they may also ask themselves: Is our herd safe from chronic wasting disease (CWD)? Managing the threat of a disease such as CWD requires a massive effort, but wildlife officials aren’t just guessing how many deer to sample. By using computer models to analyze field data, scientists determine exactly where, when, and how much we need to test to accurately understand the disease.
For a disease that affects wildlife, testing only captive animals does not provide the answers needed to understand disease occurrence and spread dynamics in wild populations. This is where computer models are handy: they let us create virtual scenarios that otherwise would be impossible to evaluate. For wildlife disease surveillance, computer models are particularly useful because wildlife populations are difficult to observe, sampling is often opportunistic, animals move across large areas, and only a subset of infected animals are detected. Therefore, computer models help researchers bypass these limitations, reduce uncertainty in decision making, and answer questions that would otherwise be impossible due to the difficulties mentioned above and the costs of testing wildlife directly. It is important to note, however, that a model is an imperfect approximation of reality that provides estimates with a certain level of error.
CWD was first detected in northern Illinois 24 years ago. Since then, diagnostic testing as part of an overall surveillance effort has been essential to understanding and managing the disease in Illinois. The Illinois Department of Natural Resources (IDNR) collects retropharyngeal lymph nodes (located between the throat and spine), which are first tested by enzyme-linked immunosorbent assay (ELISA). Lymph nodes designated as “initial reactors” (potential positives) are then tested with immunohistochemistry (IHC) to confirm a positive CWD result. IDNR then uses these data to inform disease management decisions, and researchers use them to learn more about CWD and its impact on the deer herd.
Surveillance for CWD through diagnostic testing is vital, but how many deer need to be tested? The best answer is “as many as possible.” The more data we have, the clearer the picture is, so there is no such thing as “too many” tests. However the opposite is not true: having “too few” tests weakens our ability to accurately determine what is happening on the ground (the true levels of disease), which limits the knowledge required to determine disease risk and management opportunities.
So, how do we know how many deer to test to get a sufficiently accurate picture? To find the answer to testing requirements, our study published in the journal Prion titled “Monte Carlo simulation of testing requirements for chronic wasting disease (CWD) surveillance via hunter-harvest in Illinois, USA,” used mathematical models representing herds of deer to calculate apparent prevalence for various CWD surveillance levels (Mori et al., 2026). Apparent prevalence (the percentage of animals that test positive for a disease using a particular test) is an estimate of the true prevalence calculated from a sample of the total population, with the true prevalence being the percentage of animals that are actually infected with CWD in the population. In our simulation this calculation is repeated over and over until a distribution of potential outcomes is generated for analysis. Figure 1 below visually describes the Monte Carlo simulation for Illinois’ CWD surveillance.
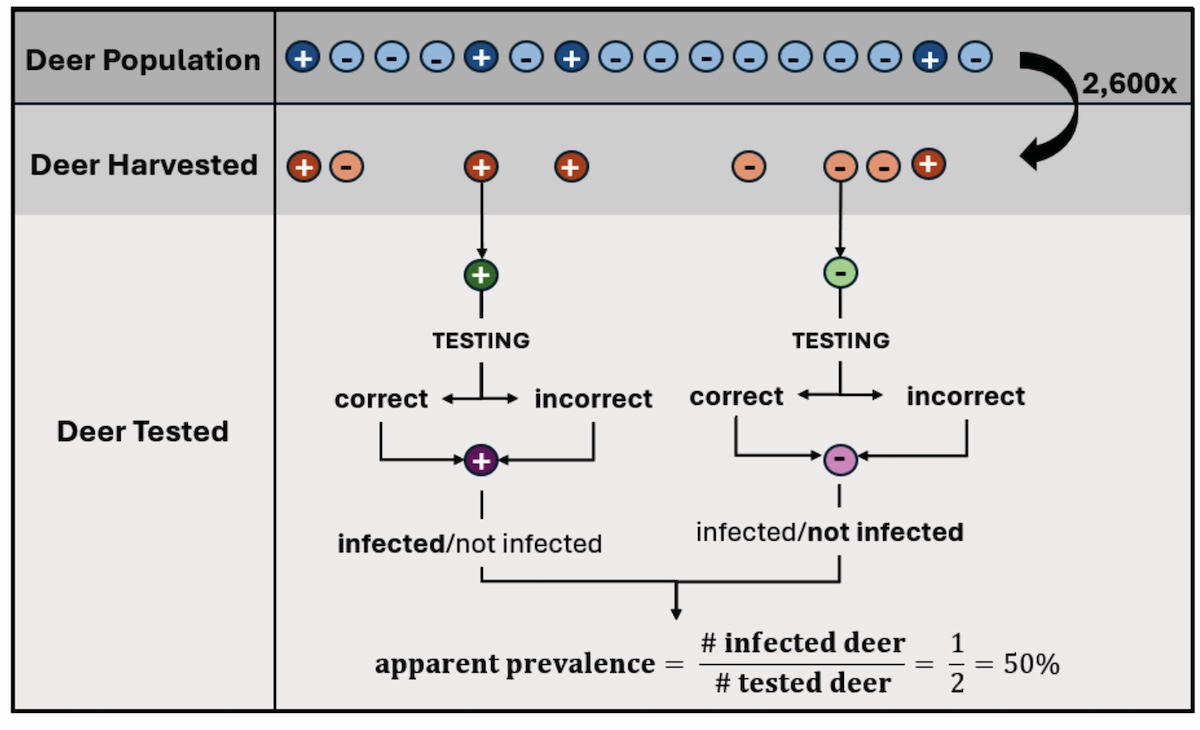
Our simulation of Illinois’ CWD surveillance examined true prevalences from 0.5-20 percent in increments of 0.5 percent (0.5, 1…19.5, 20 percent) and deer harvest values from 100-5,000 in increments of 100 (100, 200…4,900, 5,000) (Mori et al., 2026). The number of deer tested from those harvested ranged from 10 to 5,000 in increments of 10 (10, 20…4,990, 5,000), with the maximum number of tests in a single simulation run set equal to the size of the harvested group, with all values based on past CWD surveillance data. The size of the total population being sampled was set at four times the number of deer harvested (Nixon et al., 1991; Brinkman et al., 2004), making the results of this simulation applicable to any herd with as many as 20,000 animals.
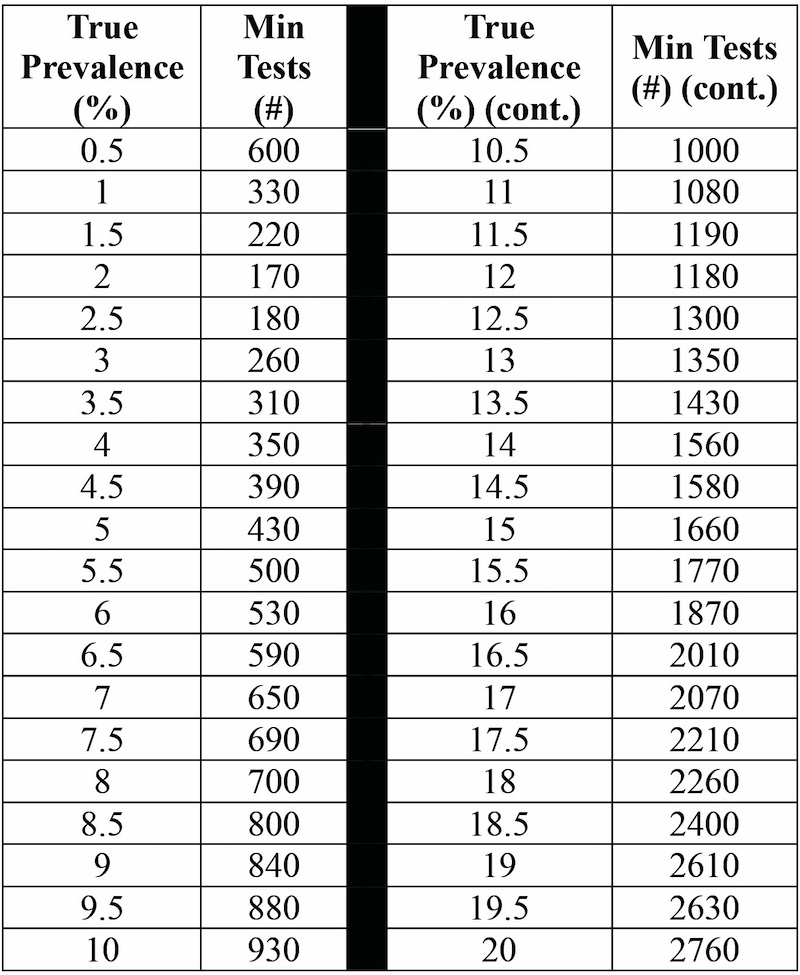
Our computer simulations help us determine how many deer to test each year to obtain an accurate estimate of CWD in a population. In this study, we define accuracy as calculating an apparent prevalence that is within ±2 percent of the true prevalence with 95 percent confidence. We developed an easy-to-use table that wildlife managers can use to plan the testing of deer for CWD and make the most of limited resources. Table 1 shows a subset of the resulting guidelines, with the full table available at https://databank.illinois.edu/datasets/IDB-5785068.
Table 1 summarizes our simulation results in an easy-to-use format. The table can be used both to set future management goals and to evaluate past surveillance efforts. For example, to identify a true prevalence of 1 percent with accuracy within ±2 percent (between 0.01 percent and 3 percent), we should test at least 330 deer. Similarly, to identify, with the same accuracy, whether the true prevalence in an area is 20 percent, we should test at least 2,760 deer. However, if we test just 1,300 deer, this can only reveal that the true prevalence is at least 12.5 percent. The table also shows that if the true prevalence in an area is ≤ 1.5 percent and we want to accurately estimate it, we will need to test more than 170 deer.
With this in mind, IDNR can use the table to see whether the sample size collected in an area was sufficient for the calculated apparent prevalence to accurately reflect the true prevalence present in that area, or to set the target number of deer to be tested according to the desired true prevalence that they want to identify. As always, more is better, but the numbers in Table 1 provide a scientifically valid and cost-effective testing quota to aim for, generated in a way that reflects the CWD surveillance process and helps integrate management with hunter harvest testing needs. Together, we can take those numbers and develop efforts to combat CWD.
Happy hunting!
El Dr. Jameson Mori es investigador postdoctoral en los Laboratorios Colaborativos de la Enfermedad Crónica del Desgaste Mateus & Novakofski. Su investigación se centra en el uso de datos y modelos para determinar el impacto de la enfermedad crónica del desgaste en los ciervos de cola blanca en Illinois y la efectividad de los esfuerzos de manejo para controlar la enfermedad. Obtuvo su licenciatura (B.S.) en la Universidad de Massachusetts Dartmouth y su doctorado (Ph.D.) en la Universidad de Illinois en Urbana-Champaign.
La Dra. Nelda Rivera centra su investigación en la ecología y evolución de enfermedades infecciosas nuevas y reemergentes, así como en la epidemiología de enfermedades infecciosas, la vigilancia epidemiológica y la determinación de hospedadores reservorios. Es miembro del Laboratorio de Epidemiología Veterinaria de Vida Silvestre y de los Laboratorios Colaborativos de la Enfermedad Crónica del Desgaste Novakofski & Mateus. Obtuvo su maestría (M.S.) en la Universidad de Illinois en Urbana-Champaign y su doctorado en Medicina Veterinaria (D.V.M.) en la Universidad de Panamá, República de Panamá.
Dr. Jan Novakofski studies prion diseases or infectious agents composed entirely of protein in animals such as “mad cow disease” and scrapie. His efforts are contributing to better understanding the genetics and transmission of these types of diseases to protect the health of animals and humans. He earned his B.S., M.S. and PhD from the University of Wisconsin, Madison.
La Dra. Nohra Mateus-Pinilla es epidemióloga veterinaria especializada en enfermedades de fauna silvestre, conservación y zoonosis. Estudia la transmisión de la enfermedad de desgaste crónico (Chronic Wasting Disease – CWD) y estrategias de control para proteger la salud del venado de cola blanca en vida libre. Trabaja en la Encuesta de Historia Natural de Illinois (Illinois Natural History Survey) – Universidad de Illinois. Obtuvo su M.S. y Ph.D. en la Universidad de Illinois Urbana-Champaign.




Envíe una pregunta para el autor